Posted: July 8, 2021

Source: AEE INTEC
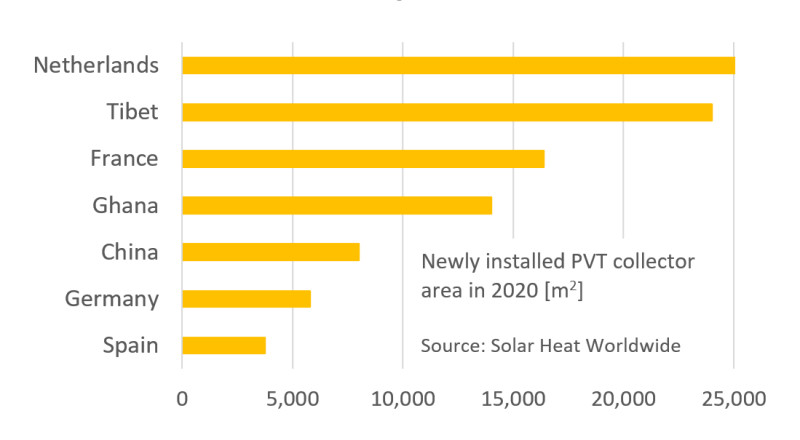
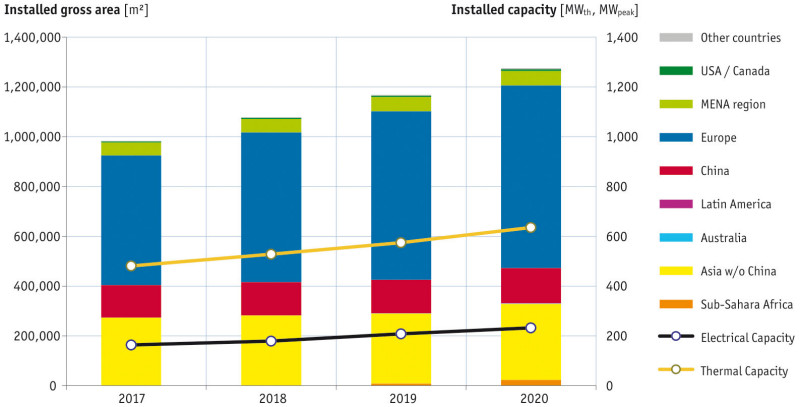
PVT collectors – which use solar radiation to produce both heat and electricity – have been gaining in popularity in a rising number of markets around the world. In 2019, the Netherlands, France and Spain claimed the top spots for the most PVT capacity added in a year. In 2020, they were joined by China, Ghana and Germany. A third survey, conducted by AEE INTEC, Austria, this year, then found PVT capacity additions jumped from 46.6 MWth in 2019 to 60.5 MWth or more in 2020. The latest survey was supported by the IEA Solar Heating and Cooling Programme, which again used its findings as a basis for a chapter on PVT market trends in the most recent Solar Heat Worldwide report. The trends that captivated the PVT market in 2019 can be viewed here.
“With every survey, we’ve expanded our PVT database,” said Thomas Ramschak, of AEE INTEC. As many as 36 manufacturers, five more than in 2020, sent over their PVT sales figures this year. Ramschak was in charge of all three surveys and was supported by his colleague, Carina Seidnitzer-Gallien, in overseeing the most recent one. He was also the chair of PVT Systems in Operation, a working group of IEA SHC Task 60 – Application of PVT Collectors, which ended in December 2020.
The surveys not only aim to identify key markets but also assess the popularity of major PVT technologies and applications. In 2020, uncovered PVT water collectors made up a whopping 60% of the global PVT capacity in operation. Air collectors ranked second, with a market share of 37%. Covered water collectors were a distant third, coming in at 2%. PVT systems that use concentrating or evacuated tube collectors played only a minor role.
Moreover, a growing number of uncovered PVT collectors was being used in combination with heat pumps to supply single-family and multi-family buildings with hot water or space heating, or both. The great advantage of PVT solutions is their higher yield per area: PVT collectors produce at least three times more energy in the form of heat and electricity than photovoltaic generators with the same surface area.

From 2018 to 2020, the total installed PVT capacity grew by an average of 9 % a year.
Source: AEE INTEC
Task 60: must-read publications
The close collaboration between research groups and industrial companies during the three-year Application of PVT Collectors project resulted in a long list of publications, which vary in size and target readership. They are shown in the table below.
More information: