T53E4 Tool – To Assess a System’s Technical and Economic PotentialFebruary 2019
Publisher: Task 53
T53E4, a technical and economic assessment tool, rates and benchmarks new developments at the system level (proper design and operation). This assessment tool provides a comprehensive database of boundary conditions that are used in various configurations and applications, which means that tool users can assess entirely different types of configurations. Users can obtain information on the efficiency and cost of a solar heating and cooling (SHC) installation and the reference system in a common comparable format. As part of this work, the Task researchers assessed and benchmarked 28 solar heating and cooling systems with the cooling capacity ranging from 5 kW to more than 150 kW.
The tool’s reference system consists of a natural gas boiler and an air-cooled vapor compression chiller. All key results are provided in a normalized form. This means that a specific reference was selected to avoid a discussion about the absolute values and the right choice of boundary conditions.
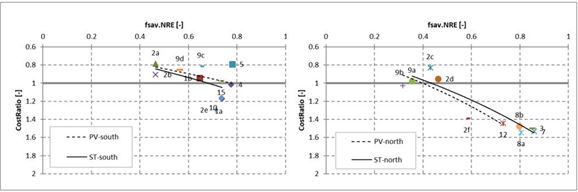
Results of analyses using the T53E4 tool: The cost ratio is shown on the y-axis over the non-renewable primary energy savings fsav PER-NRE on the x-axis. The graph on the left shows the configurations at southern sites, where cooling demand dominates over the summer. The graph on the right shows results from northern locations, where the need for cooling is lower during the same period
Two main parameters were calculated from the monthly energy balance of each configuration: • The non-renewable primary energy savings (fsav PER-NRE), which compares the non-renewable primary energy demand of an SHC system to those by a reference system. The fsav ranges from 0.3 to 0.94, which means that solar energy replaces 30% to 94% of non-renewable primary energy demand of the reference system.
The cost ratio (CR) to describe the levelized cost of energy (LCOE) of an SHC system as opposed to the LCOE of a reference installation. The LCOE is derived from annuities paid over the lifetime of a system (typically 25 years). A CR below 1, such as 0.8, indicates that the solar device offers a 20% reduction in costs compared to the baseline, while a CR above 1, such as 1.4, describes a system that raises costs by 40%.
The configurations were then grouped by boundary conditions, for example, whether the location is in the south or north, and identified separate lines for solar heat and PV. Northern installations consist of those in Austria, Finland, Germany, Sweden, and Switzerland. Sites in the south are found in Italy, Spain, France, and China. The southern locations depicted on the left graph below show promising results, with between 40% and 70% of energy savings at a total cost lower than that of the reference systems. This amount of saving is possible for both PV (see dotted line) and solar heat (see continuous line). If the industry could offer reduced system costs by only 15%, energy savings could be as high as 80% and the units would be cost competitive in southern locations.
The cooling systems in northern locations, where there is less demand for air conditioning (graph on the right-hand side above), paint an entirely different picture. Only if primary energy savings are kept to 40% systems can be cost-competitive to references. Aiming for savings of between 60% and 80% will increase costs tremendously. Again, it is the investment that had the strongest impact of all parameters. If investment costs are reduced by at least 30%, cost-effectiveness could be guaranteed along the entire trendline.
What this tool shows is that cost-competitive solar cooling configurations are possible even with today’s investment cost models. And, that solar technologies can be optimized for solar heating and cooling. Whether solar thermal or PV is the more favorable option will mostly depend on the location and the design of the system.
T53E4 Tool
Contacts: Daniel Neyer (daniel@neyer-brainworks.at) / Rebekka Koell (r.koell@aee.at)